Essay Title
Use this text area to enter a brief abstract of your essay (<50 words). Below, edit the file viewer below to link to the uploaded PDF of your essay. To the right, include an image from your essay. For your next essay you can simply “duplicate” this “group” of blocks and edit them with the new info.
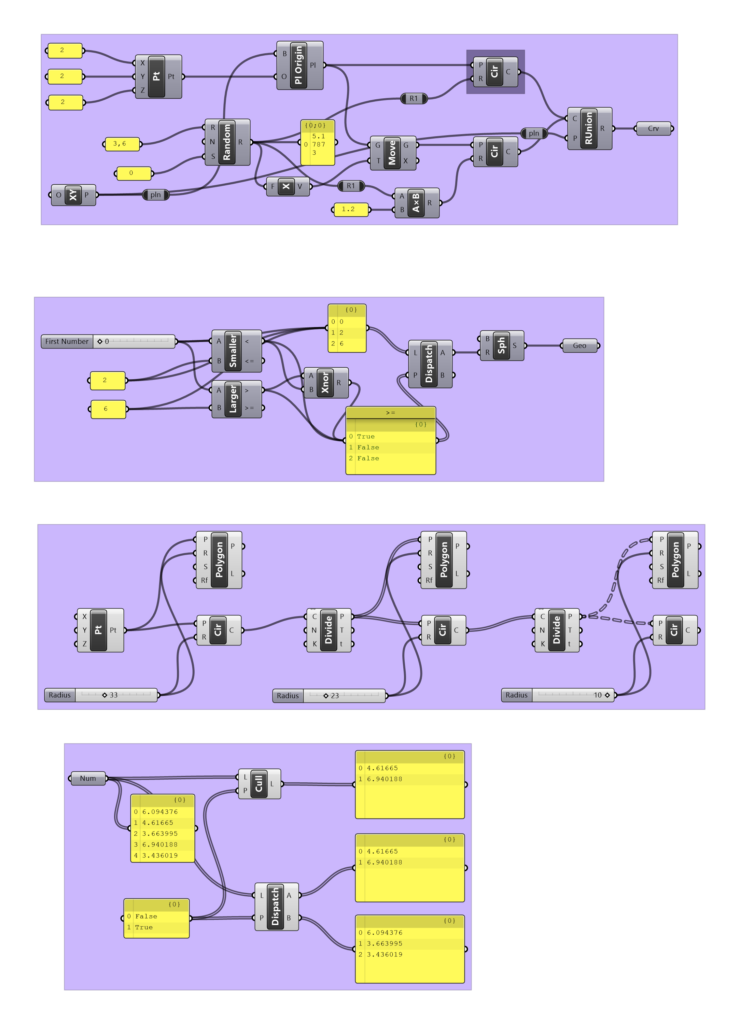
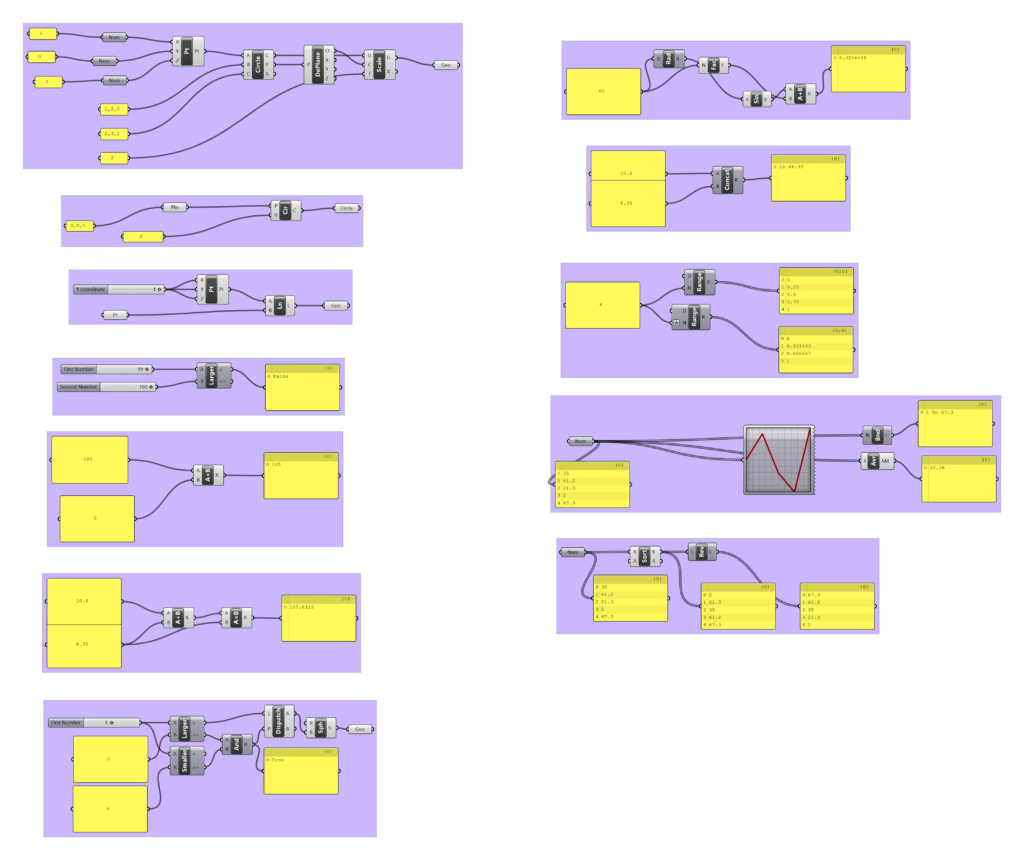
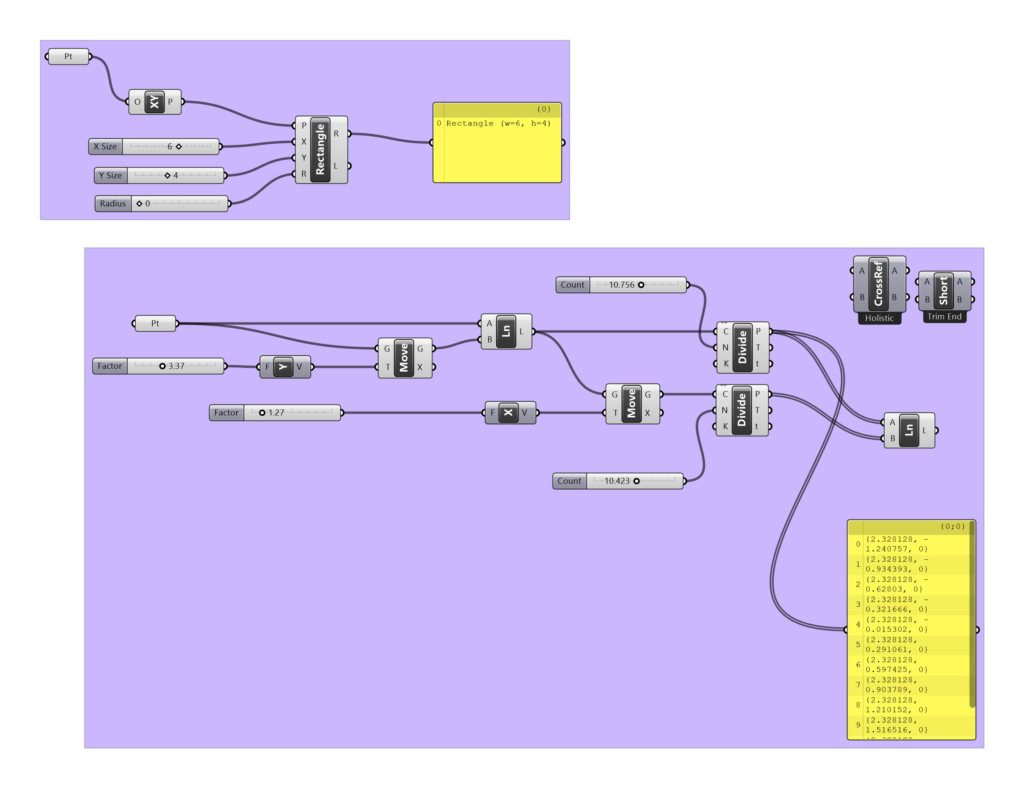
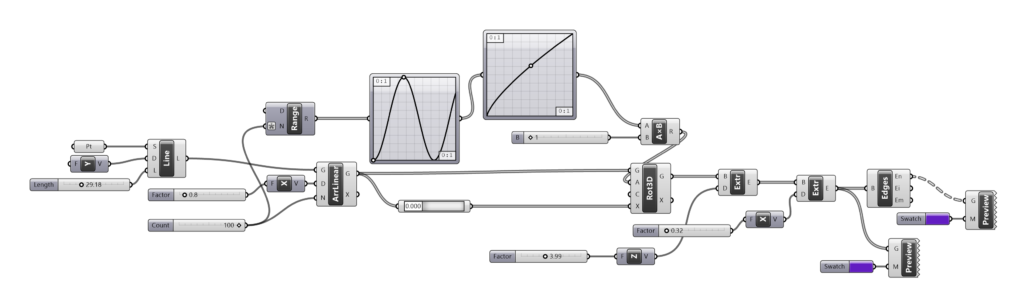
Skill Building
A series of technical exercises build and demonstrate skills in writing algorithms with Grasshopper and related tools.
Grasshopper Week 1
1.1 Play


1.2 PDF Tutorials
1.3 Youtube tutorials
Grasshopper Week 2
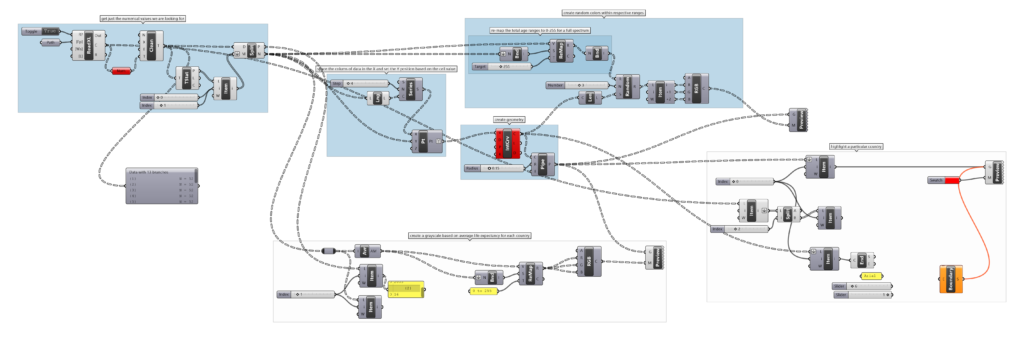
2.1 Numeric data to volumetric geometry
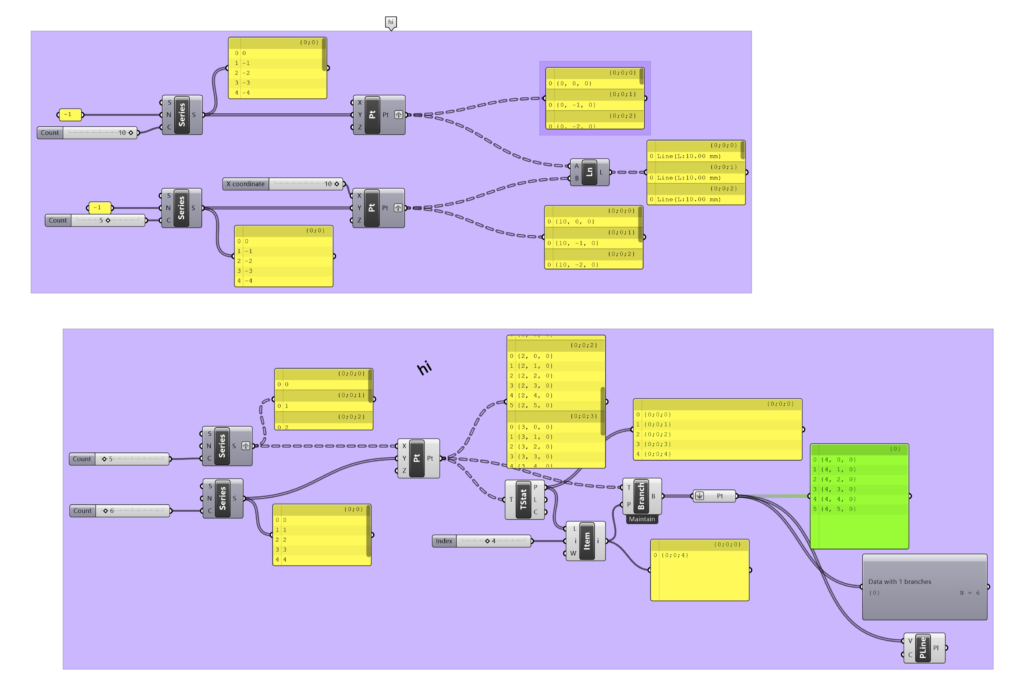
2.2 Numeric data to points and lines

Grasshopper Week 3
3.1 Numeric data to 3D curves


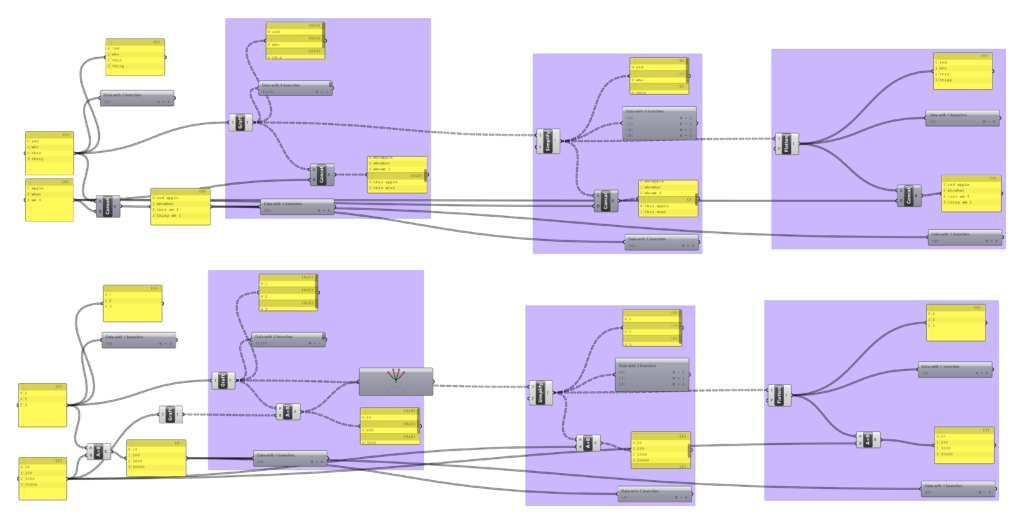
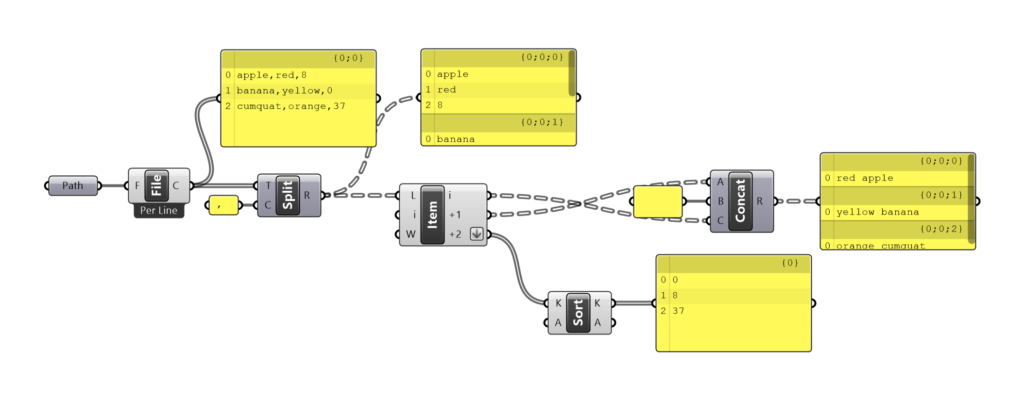
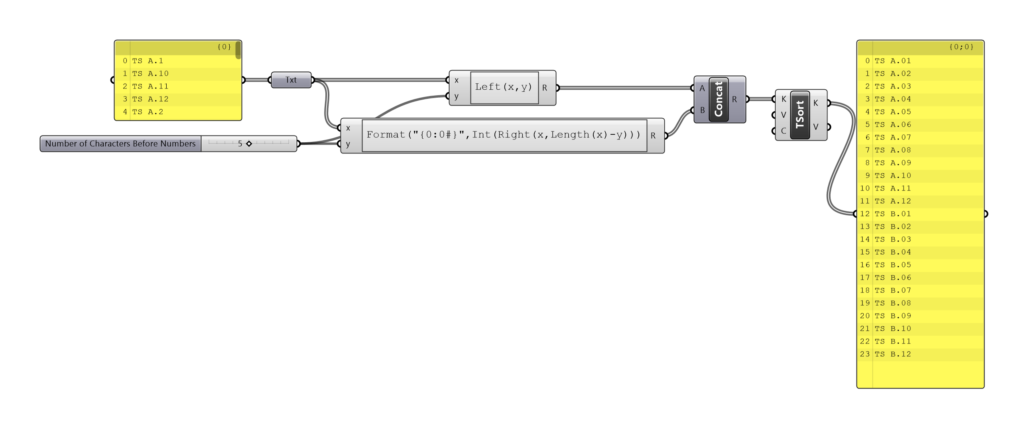
3.2 Data sorting
3.3 Data sorting
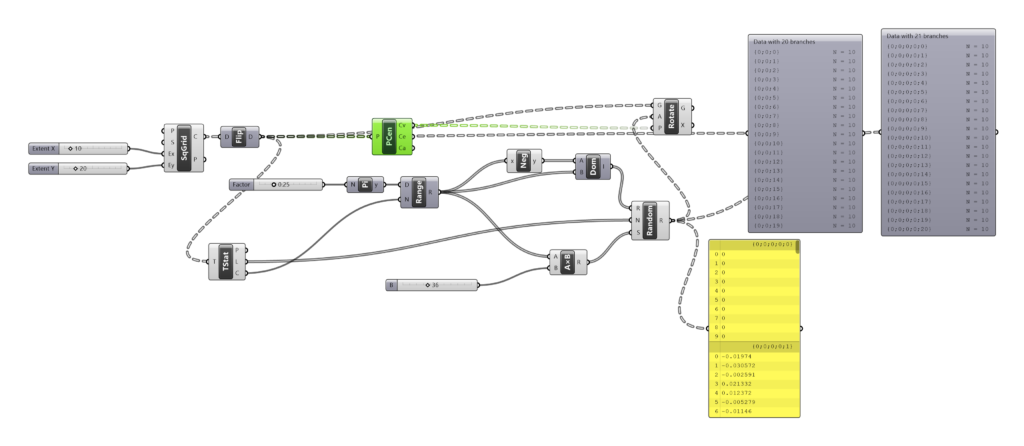
3.4 Grid geometry variation

Grasshopper Week 4
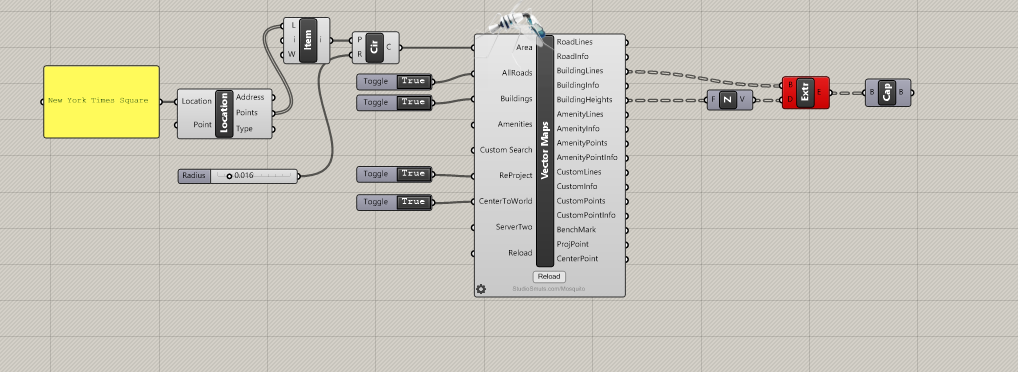
4.1 Mosquito Tutorial
4.2 Graphmapper Tutorial

Week 5
5.1 Excel sheet data graph
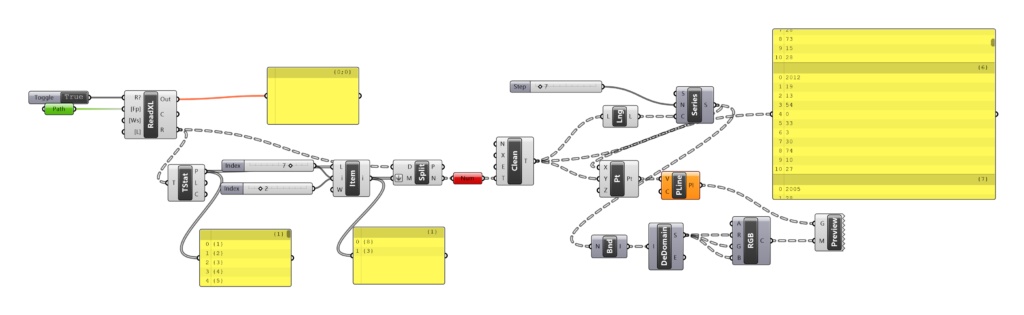

5.2 Excel Demo
Week 6
6.1 CSV sort
6.2 Project 2 Excel data graph


6.3 Study for Project 2
Week 7
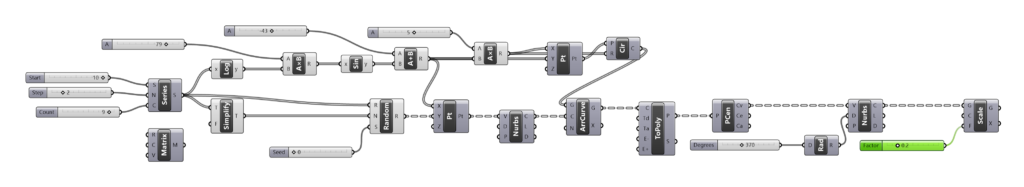
7.1 Data Sorting Studies for Project 2
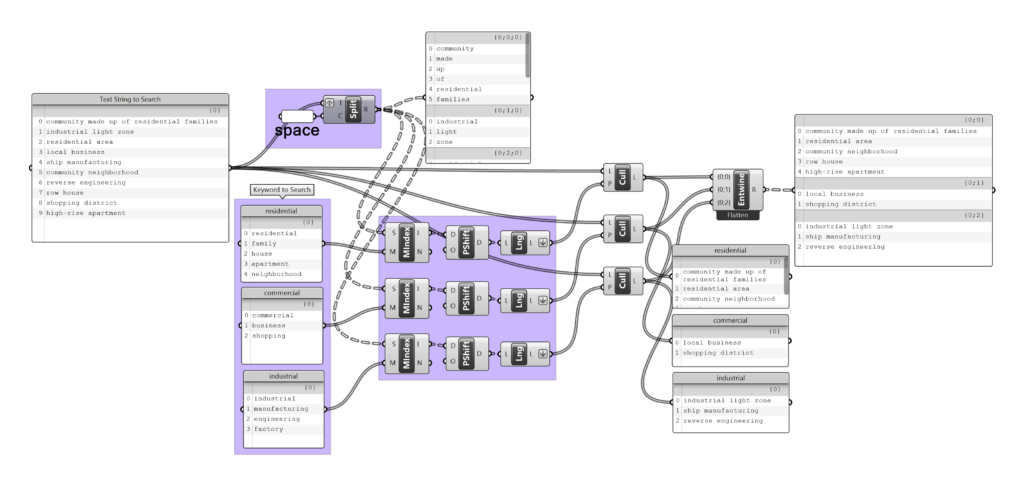
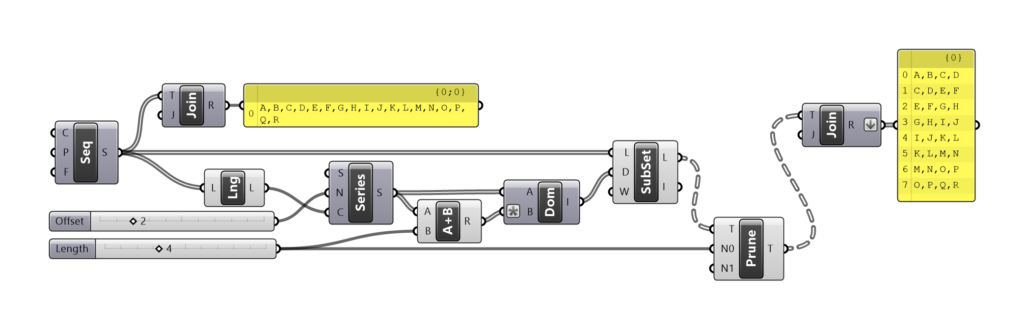
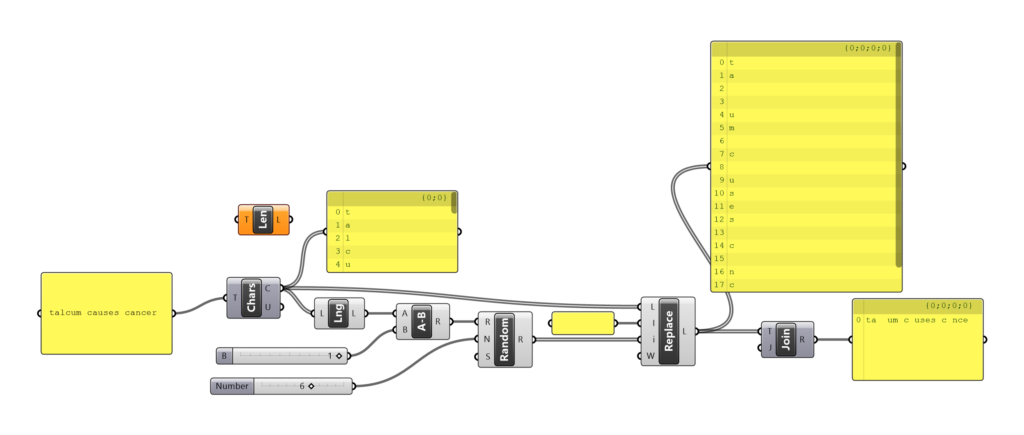
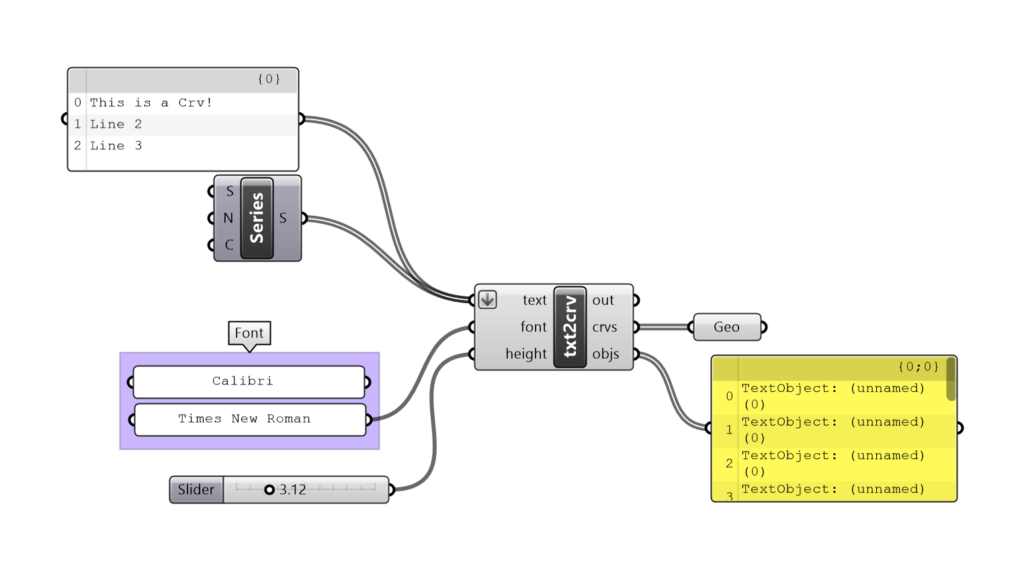
7.2 Text to Curves

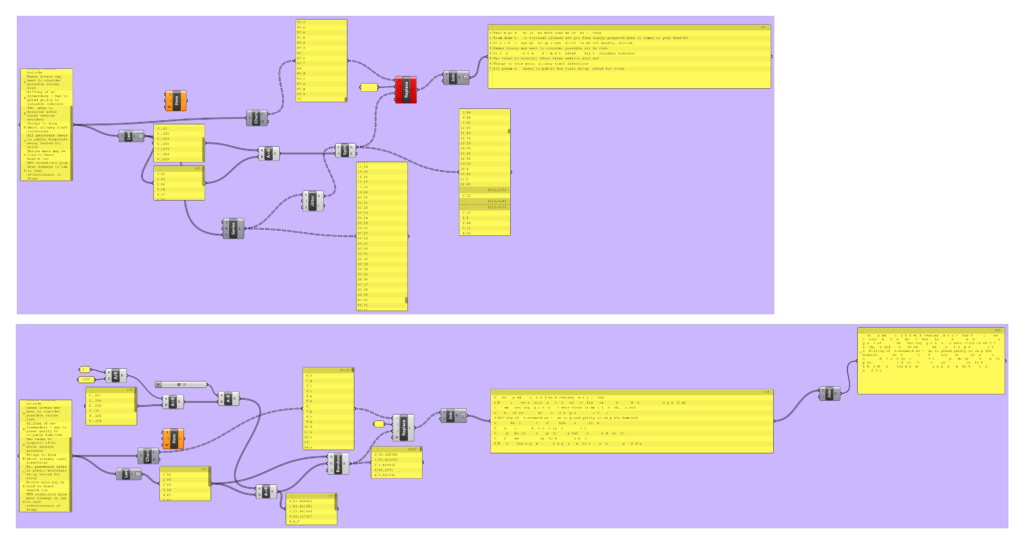
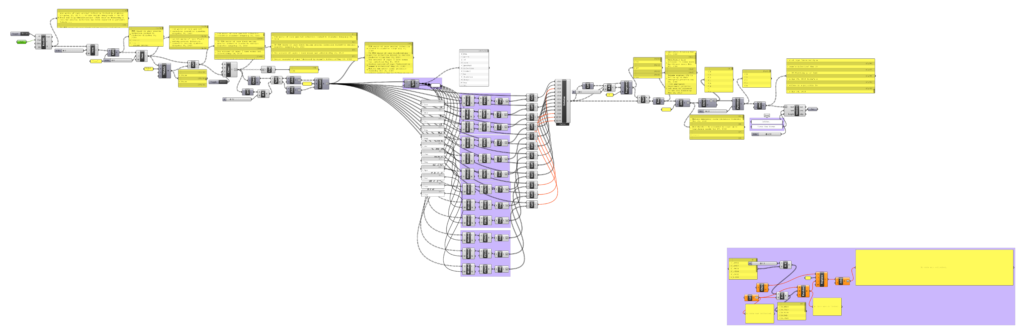
7.3 Definition testing (for 1 out of 10 data sheets)

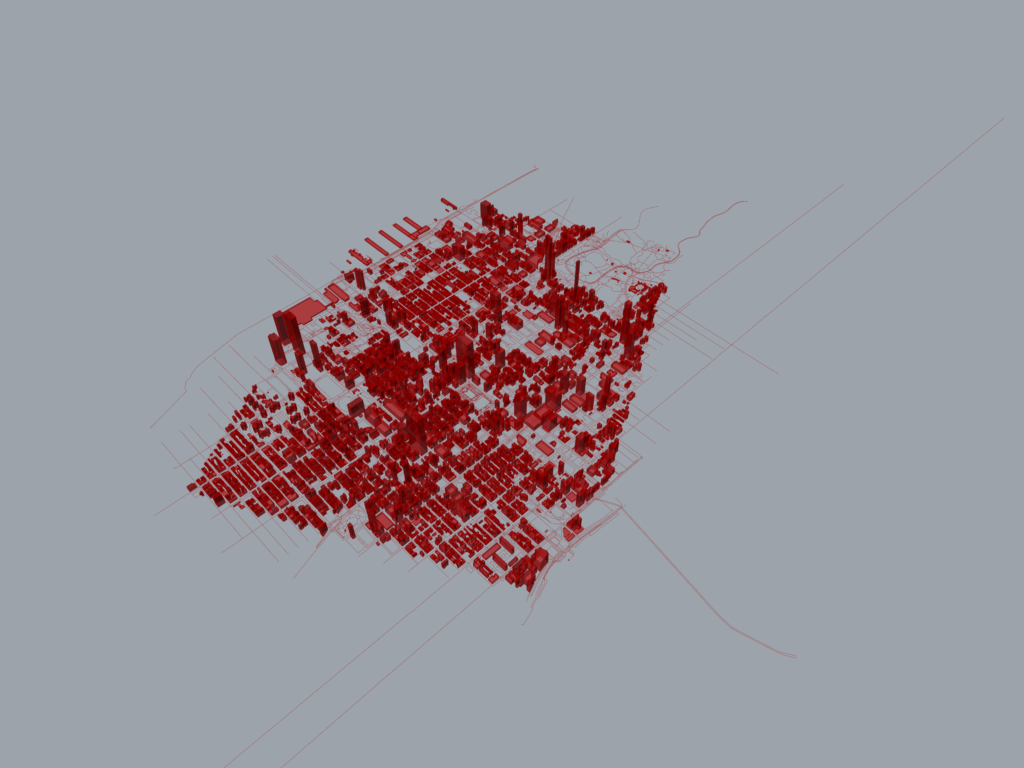
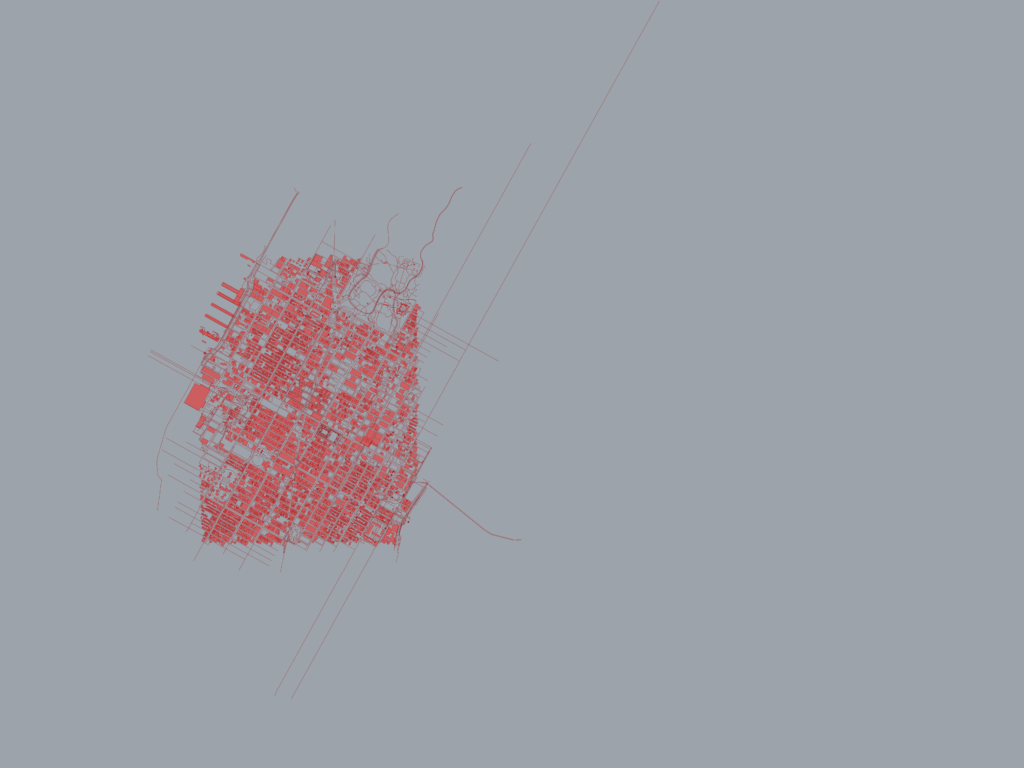
Project 1(ink on paper, size varying)


Drawing with Math Functions
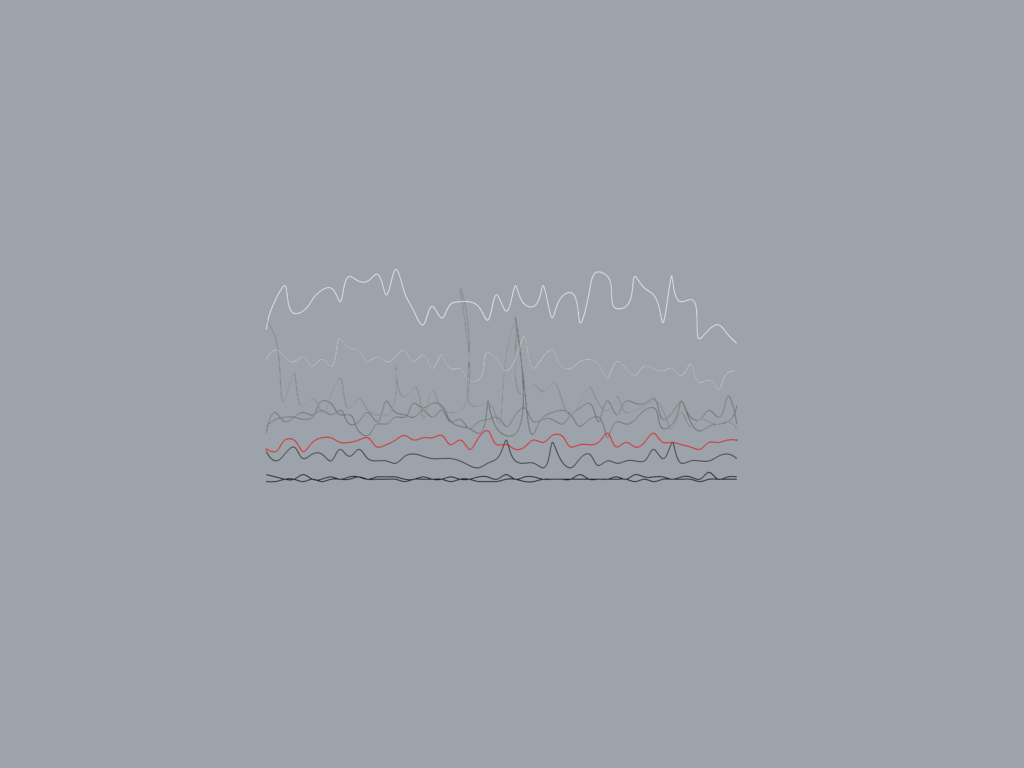
Project 2 (pigment print on paper, 102″ x 88″)
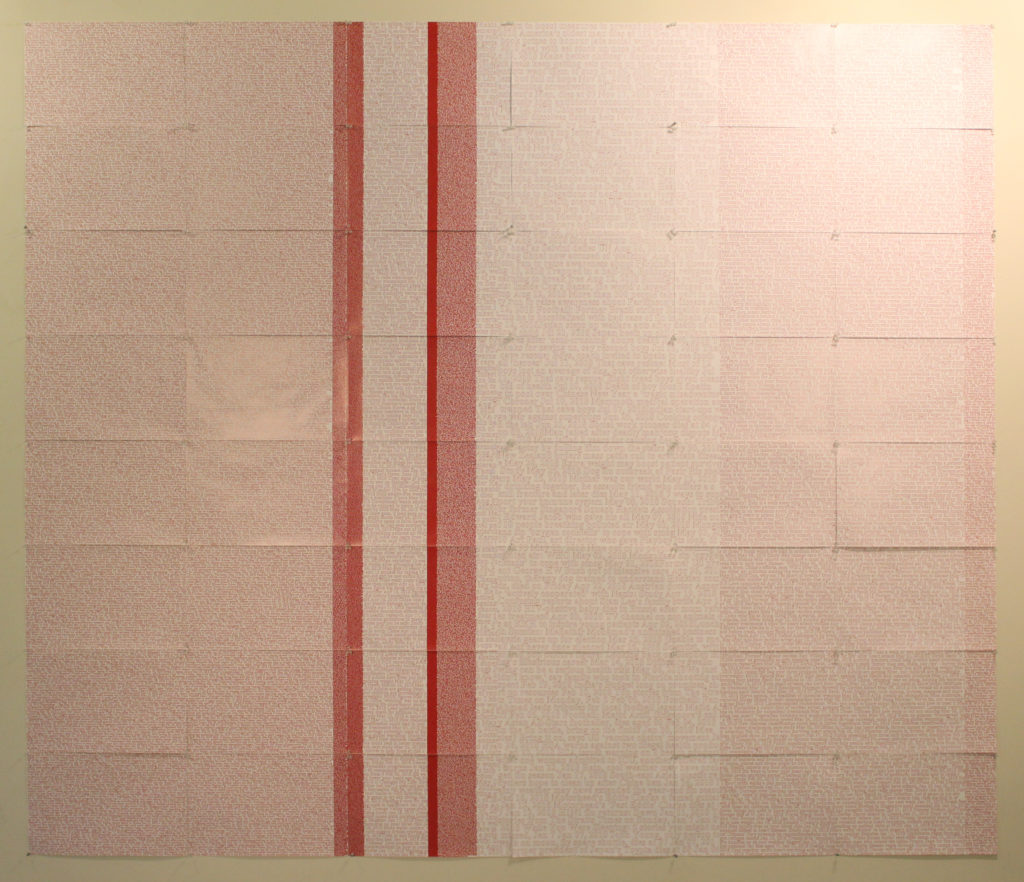
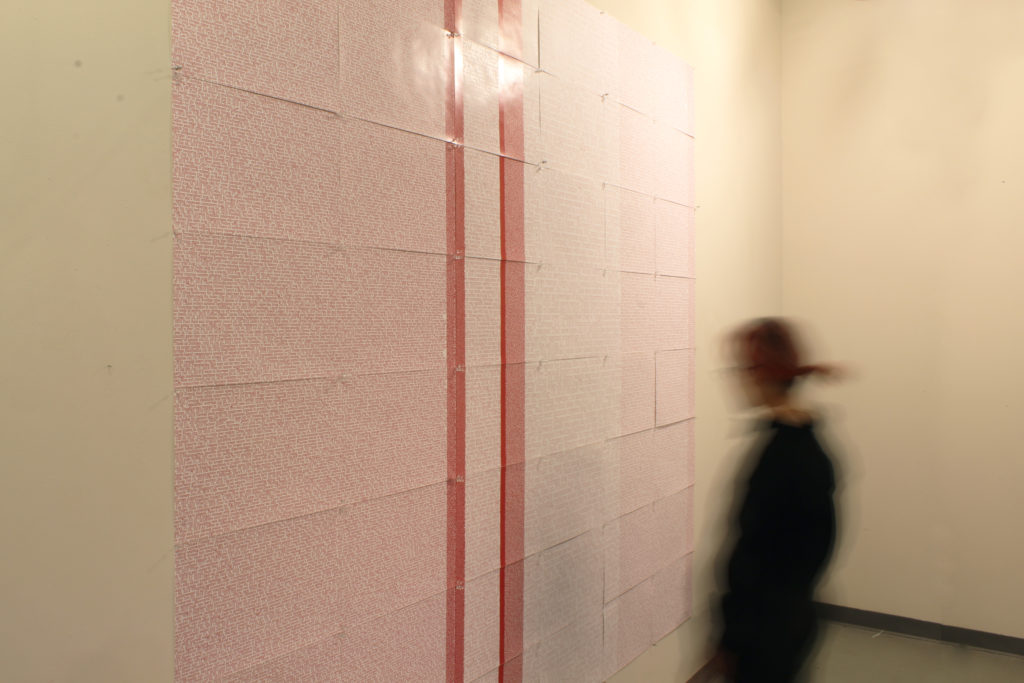


Columns from left to right: Cancer, Diabetes, Suicide, Stroke, Homicide, Traffic Collision, Urinary Tract Infection, Pneumonia, Heart Disease, Kidney Disease
Top cause of death: Cancer (28.8%); Bottom cause of death: Homicide (0.9%)
Most reported cause: Homicide (1745 articles in 2018); Least reported cause: Urinary Tract Infection (15 articles in 2018)
Most over-reported cause: Homicide; Most under-reported cause: Pneumonia
Causes of Death and Media Coverage
The digital archive of public data-sets by the Singapore government, Data.gov.sg, presented 21,820 as the number of deaths in Singapore in the year of 2018. It also stated the principal causes of the deaths (the following order from greatest to least) – Cancer, heart disease, pneumonia, stroke, traffic collision, kidney disease, urinary tract infection, suicide, diabetes, homicide. These keywords were individually keyed into the search function of the online database of the leading newspaper in Singapore, straitstimes.com. The returned search results in the form of articles headlines (from 2018) were then extracted, collated, and formatted as a continuous string of text (in chronological order) in Grasshopper. Each keyword or cause of death was allotted one string of text arranged into a column. The ratio of the column width to the sum of all column widths corresponds with the ratio of number of deaths caused to the total number of deaths. The string length is determined by the number of articles/headlines returned. In order for the strings to fit within their respective columns, the font size varies accordingly and so does its text density. Causes of death which were over-reported had columns more dense and red as the text became less discernable while those which were under-reported had columns that were more white and sparse and text that became alarmingly larger. Through this manner of visualization, the piece attempts to subvert the impact of news media on our perception of causes of death.
More Information
additional information and links